 Feeding & Weight Disorders
Body Composition
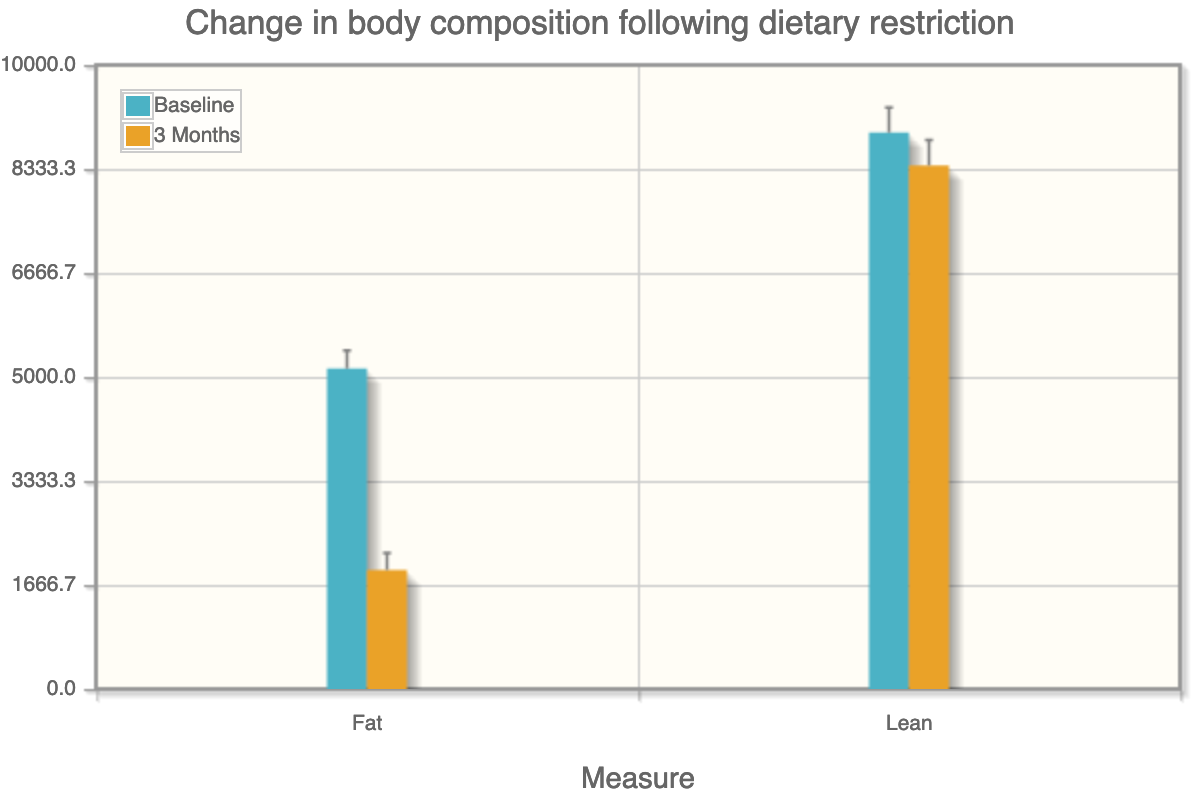
Percent body fat can be measured by Dual Energy X-ray absorptiometry (DEXA) or MRI and with these techniques, segmentation of visceral and subcutaneous fat in the dog is feasible. A further advantage of these imaging techniques is that repeated assessments in the same animal are feasible for longitudinal study designs. The obese dogs, having stabilized to their increased body weight, were given DEXA scans and then placed on a restricted diet in which food intake was reduced by 15% for 3 months.
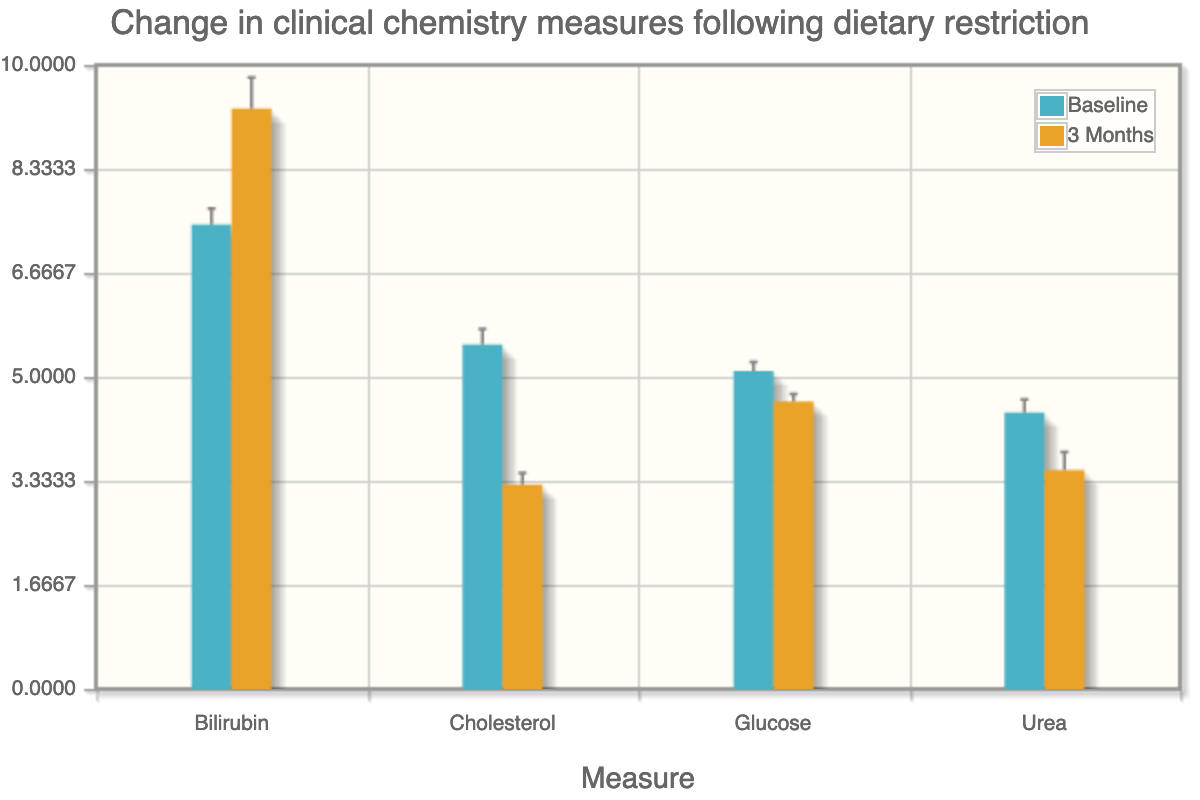
The figures below illustrate changes in body composition and blood chemistry following dietary manipulation. (A) Reducing caloric intake for 3 months led to marked reduction in total body fat and a much smaller reduction in lean mass as measured using DEXA imaging. (B) Secondary measures of clinical chemistry revealed this dietary restriction regimen to significantly reduce blood cholesterol and glucose levels compared to baseline.
Food Intake & Body Weight
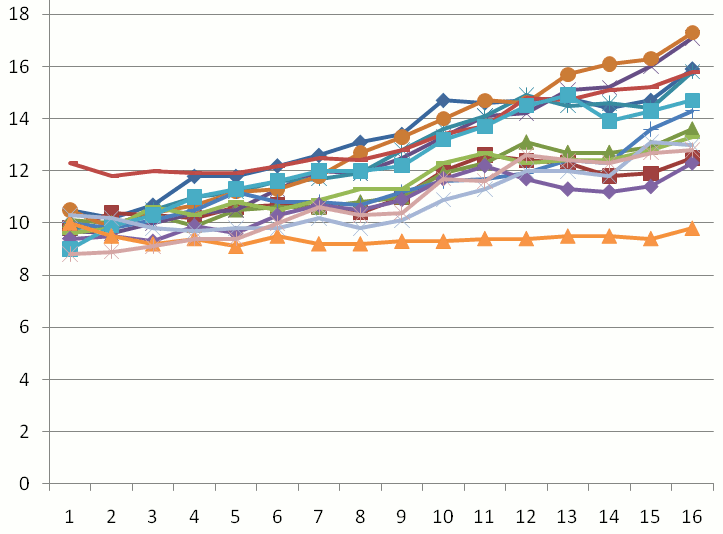
In a representative study, 14 neutered beagle dogs of both sexes were fed their normal laboratory diet (Purina Pro Plan) once daily for half hour per day, but at an individually increased level, with the goal of raising body fat to a level of 25%. Collectively, body weight increased progressively over a four month period, with an overall group increase of 42 % compared to baseline. As a group, the animals achieved this level of body fat within 4 months. The increase in body fat was accompanied by modifications in several blood chemistry parameters. There were, however, individual differences: most but not all animals became obese, indicating that dogs can also model the individual differences seen in human obesity.
Glucose Tolerance & Insulin Sensitivity
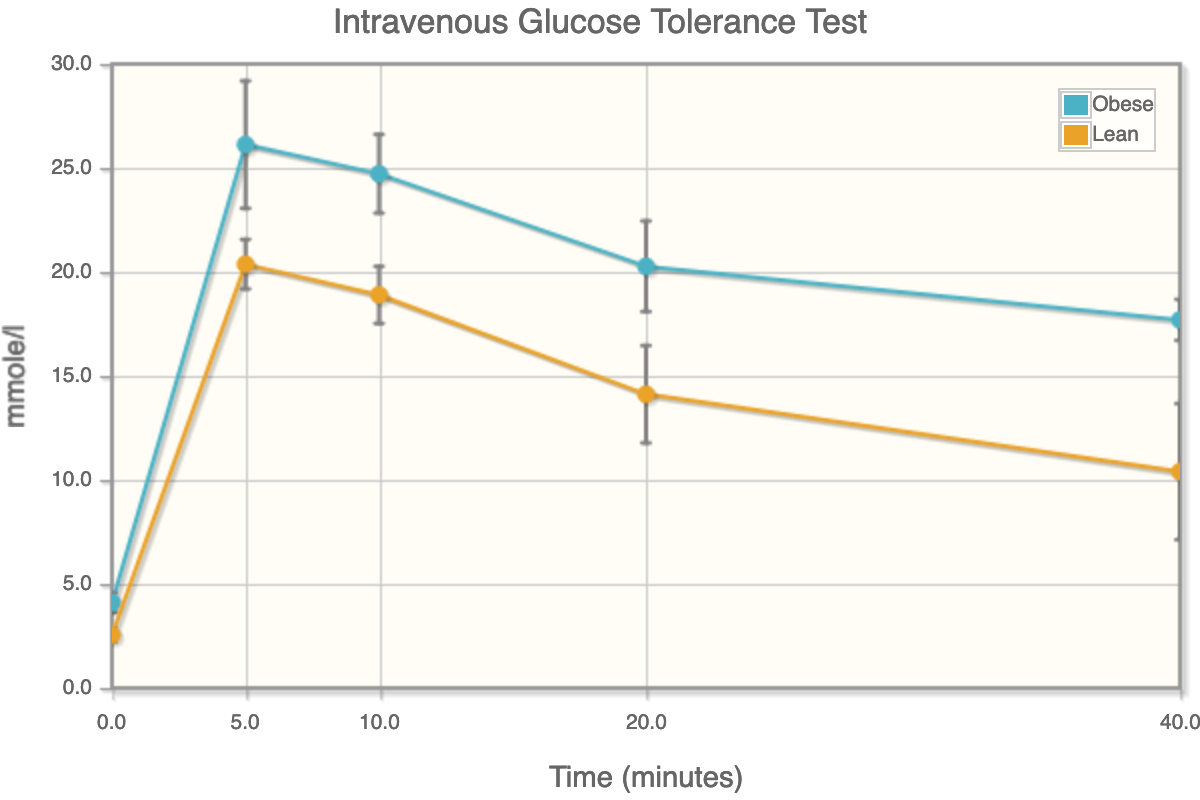
Glucose tolerance and insulin sensitivity tests can also be built into the test design. An intravenous glucose tolerance test measures the blood glucose levels following an intravenous bolus of dextrose in a fasted dog and is a measure of glucose intolerance.
Palatability
Palatability is defined as the subjective pleasure associated with eating a given food over another.
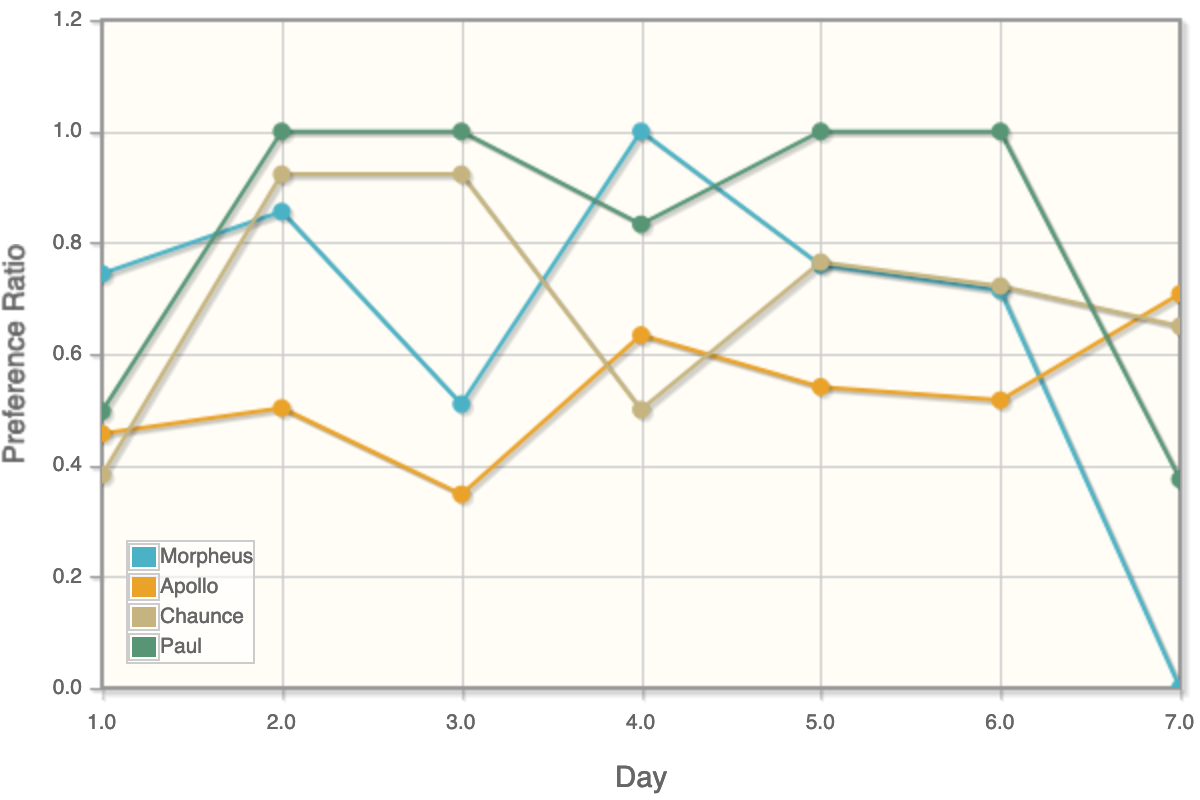
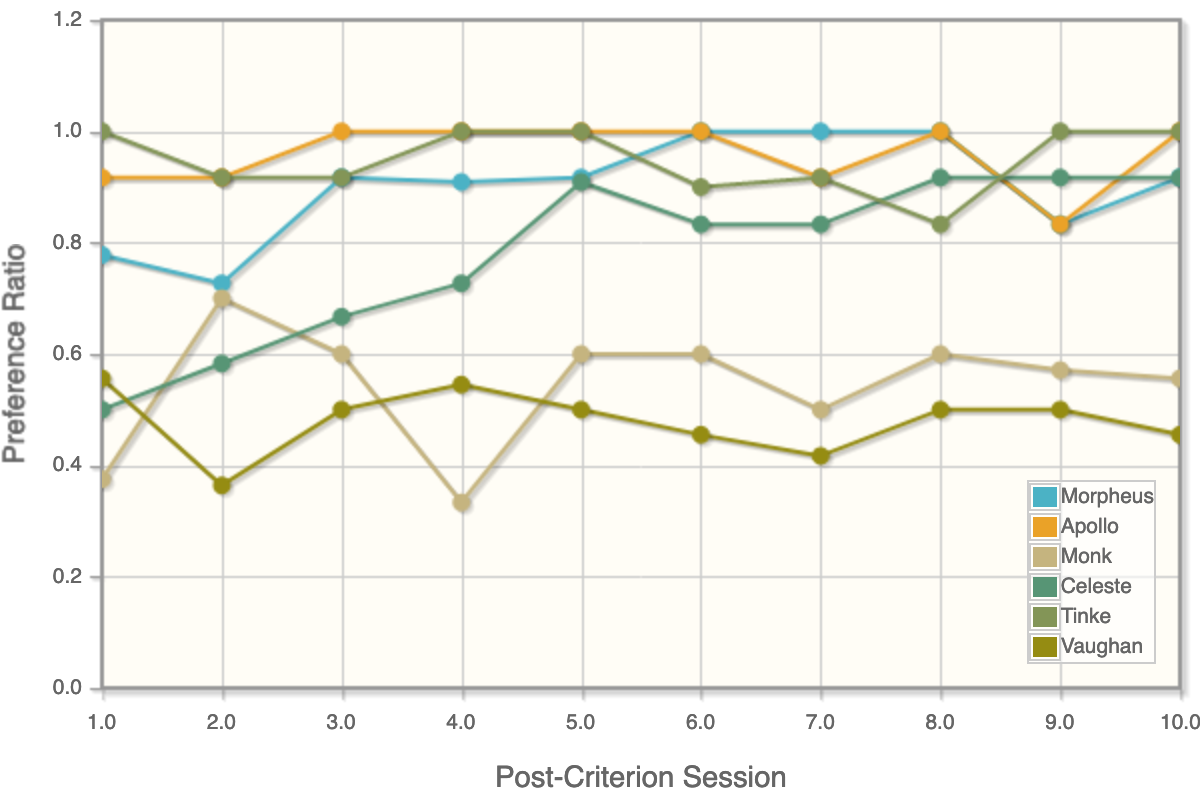
We can provide two different means of assessing palatability. The first, the two pan test, is the industry standard, in which subjects are given a choice of eating two different foods, and the preferred food is the most palatable. The second, the cognitive palatability assessment protocol (CPAP), was developed as an alternative by CanCog to provide a means of testing palatability that require smaller quantities of food. The CPAP is ideal for establishing preference of:
- Satiety inducing diets
- Small quantities of test food (e.g., tablets)
Satiety Assessment
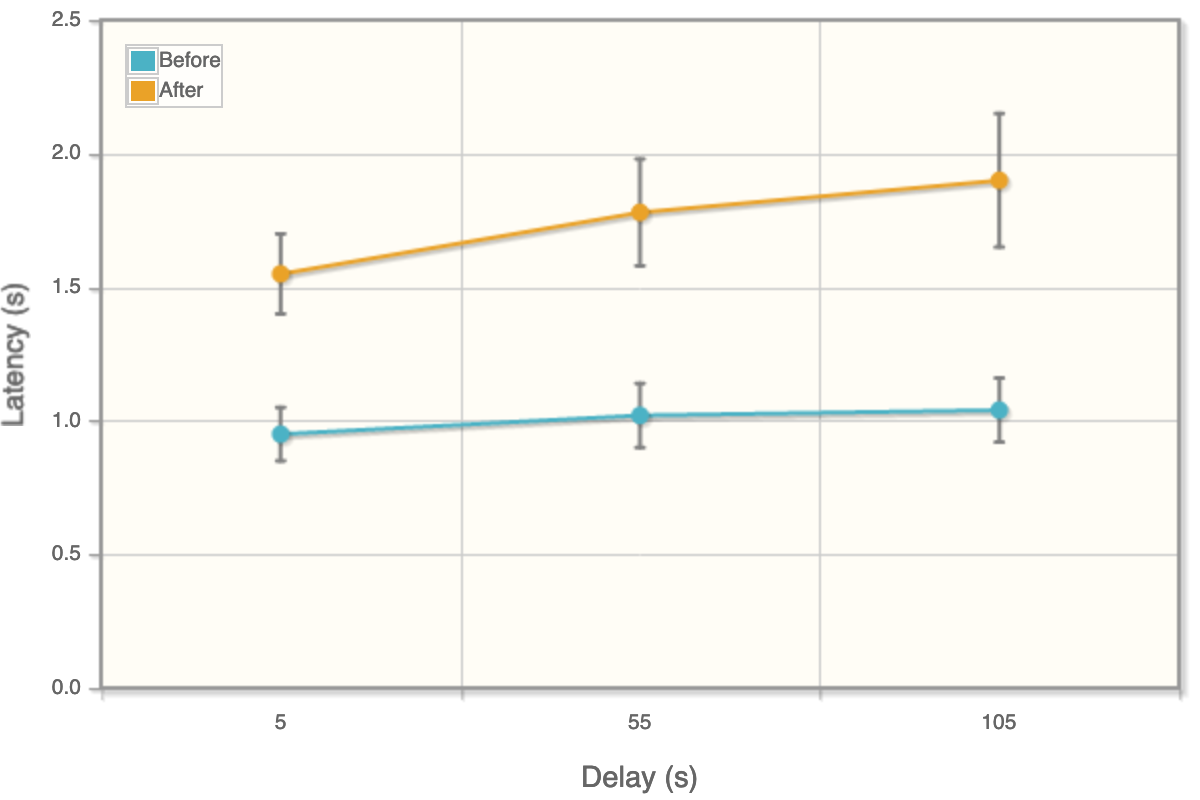
Our satiety assessment protocol provides a behavioural measure is independent of food intake that is sensitive to the experience of satiety. The target measure is latency to make a response in learning task requiring mental effort. More specifically, the task requires the animals to hold information in memory for either 5, 55 or 105 seconds and then respond. Animals that are highly food motivated will respond more rapidly than animals experience satiety.
